Preliminary Results for the 52 weeks ended 26 December 2009

04 March 2010

Download

The full results
are available in PDF Format


HIGHLIGHTS

Galiform's Chief Executive, Matthew Ingle, said:

"The strength and flexibility of Howdens' business model, which is focused on the small builder, and the timely pro-active steps we took in response to the economic downturn enabled us to deliver a strong set of results, despite challenging market conditions. Relentless operational focus led to a significant improvement in gross profit margin, which resulted in an increase in operating profit. Strong cash flow meant we had net cash at the year-end. This was despite the costs associated with legacy issues, on which we continue to make good progress.

"We expect market conditions in 2010 to remain challenging and are cautious about the outlook for the year. As the year evolves, and we enter the next stage of Howdens growth and development, we will continue to adapt to any changes in market and economic conditions."

Financial results

  • Howden Joinery UK depot revenue decreased by 3.4% to £756.4m (down 4.6% on same depot basis). Group revenue totalled £769.5m (2008: £805.7m);
  • Gross profit margin rose from 53.1% to 56.2%, despite the impact of adverse currency movements;
  • Operating profit before exceptional items increased by £3.6m to £79.5m;
  • Profit before tax and exceptional items fell by £5.6m to £68.7m, mainly reflecting the £11.3m increase in the net finance charge in respect of pensions;
  • Basic earnings per share from continuing operations before exceptional items of 8.3p (2008: 8.5p);
  • Basic earnings per share from continuing and discontinued operations of 7.6p (2008: 8.6p loss);
  • Net cash inflow from operating activities of £71.4m;
  • Total net cash inflow of £130.8m before cash payments totalling £46.3m relating to 'legacy' properties and a payment, in excess of the operating charge, of £20.9m to the Group's pension schemes (the 'pension deficit contribution');
  • Net cash of £2.4m at 26 December 2009 (27 December 2008: £61.2m net borrowings), including the impact of a £35.0m reduction in stock levels.

Business developments

Howden Joinery continues to strengthen its competitive position:

  • 8 new Howden Joinery UK depots opened in 2009, bringing total to 462, with 20 to 30 openings planned in 2010;
  • Review of kitchen range identified opportunities to improve choice and service: roll-out has commenced;
  • Continuing smooth roll-out of major IT projects with implementation of upgraded kitchen planning tool.
  • In addition:
  • Group's bank facility extended until May 2014;
  • Continuing successful mitigation of legacy issues – two more deals on legacy properties since November 2009 Interim Management Statement – current liability c. 30% lower than at end of 2008;
  • Continued sourcing improvements in purchasing, manufacturing and logistics.

Current trading

  • In what is the quietest time of year for the business, Howden Joinery UK depot revenue in the first two periods of 2010 was down by 3.7%* (down 4.1%* on a same depot basis) compared to the same two periods in 2009, reflecting impact of snow and prolonged spell of cold weather.

*Note 1: Week 1 sales excluded because of distortion arising from New Year's Day falling on different days of the week (Thursday in 2009, Friday in 2010), which meant there was no trading in the first week of this year (2009: £0.8m).


SUMMARY OF GROUP RESULTS

The information presented below relates to the 52 weeks to 26 December 2009 and the 52 weeks to 27 December 2008, unless otherwise stated.

£m unless stated 2009 2008
Continuing operations before exceptional items unless stated


Revenue
- Group
769.5 805.7
- Howden Joinery UK depots 756.4 782.9
Gross profit 432.1 427.5
Gross profit margin, % 56.2 53.1
Operating profit 79.5 75.9
Profit before tax

- excluding exceptional items 68.7 74.3
- including exceptional items1 68.6 79.1


Loss from discontinued items before tax

- including exceptional items1 (4.4) (108.8)


Earnings per share from continuing operations

- basic excluding exceptional items 8.3p 8.5p
- basic including exceptional items 7.6p 9.2p


Earnings/(loss) per share from continuing and discontinued operations

- basic excluding exceptional items 8.3p 8.5p
- basic including exceptional items 7.6p (8.6)p


Net debt at end of period 2.4 (61.2)

1 Details of exceptional items are given in note 3 to the Condensed Financial Statements.          

FINANCIAL REVIEW

The following discussion relates to continuing operations unless otherwise stated.

FINANCIAL RESULTS FOR 2009

The financial performance of the Group during 2009 benefited from the strength of the Group's competitive position and the characteristics of the end-users of its products.  This includes significant exposure to the tenanted housing sector, both public and private, which are subject to different economic drivers than the owner-occupied sector, and very limited exposure to the new housing market. Performance also benefited from actions taken during the course of 2008 and 2009 to enable the business to cope with weaker economic and market conditions, including rationalising depot costs and pursuing opportunities to improve gross profit.

Total Group revenue fell by £36.2m to £769.5m, primarily reflecting a decrease of £26.5m through Howden Joinery UK, and also reflecting the termination of sales to Hygena Cuisines early in the year.


Revenue £m 2009 2008
Group 769.5 805.7
including:
Howden Joinery UK depots
MFI* /Hygena Cuisines
Houdan France

* no sales in 2008

756.4
12.0
1.1

782.9
11.1
11.7

Howden Joinery UK depot revenue fell by 3.4% to £756.4m, declining 4.6% on a same depot basis.  Trading conditions were stable throughout the year, with evidence of improving market sentiment emerging in the second half. Comparative sales performance improved as 2009 progressed, reflecting the deteriorating sales pattern seen during 2008. In the last three periods of the year, from early October, underlying sales were around 4% higher than in the comparable periods in 2008.

Sales by our French depots of £12.0m were down 8% in constant currency terms.

Gross profit rose by £4.6m to £432.1m. This reflected an increased focus in our depots on gross profit margin and the benefit of a small price increase implemented early in the year. In addition, gross profit benefited from purchasing and manufacturing efficiencies. These were partly offset by the impact of the lower underlying sales volume and the £11.7m adverse effect of the exchange rate on the cost of goods purchased from overseas suppliers.

As a result, the gross profit margin for the year was 56.2% (2008: 53.1%).

Selling and distribution costs and administrative expenses increased slightly to £352.6m (2008: £351.7m).

Within this, operating costs in Howden Joinery depots opened before 2008 fell as a result of changes to resource levels made in the middle of 2008.  In addition, logistics (warehouse and transport) costs were reduced. However, these and other cost savings were partly offset by the impact of inflation on certain other costs (e.g. payroll, property and energy), the costs of newer depots and the reversal of one-off cost savings made in 2008.

It should be noted that within operating costs there were certain savings in 2009 totalling around £4m that were 'one-off' in nature.

There has been no material increase of bad debt write-offs at this stage. However, the provision for bad debt has increased, reflecting delays in our ability to recover debt through the judicial system and the consequent increase in the ageing of the debtor book.

Operating profit before exceptionals rose by £3.6m to £79.5m.

The net interest charge rose £9.2m to £10.8m, mainly due to the £8.0m finance expense in respect of pensions (2008: £3.3m income).  The net result was profit before tax and exceptional items of £68.7m (2007: £74.3m).

There was a small exceptional charge before tax of £0.1m in respect of continuing operations and an exceptional charge before tax of £4.4m in respect of discontinued operations. The latter was reported in the first half of the year and related to the rent and other obligations payable on nine properties which had been occupied by Sofa Workshop prior to it going in to administration early in 2009.

The tax charge on profit before exceptional items from continuing operations was £18.5m, an effective rate of tax of 26.9%.  This was a result of one-off adjustments, our underlying effective tax rate being around 32%.

Basic earnings per share excluding exceptional items from continuing operations were 8.3p (2008: 8.5p) and including exceptional items were 8.3p (2008 9.2p). Basic earnings per share including exceptional items from continuing and discontinued operations were 7.6p (2008: loss of 8.6p)

Net cash inflows from operating activities were £71.4m.

Within this, stock levels at the end of the year were £35.0m lower than at the end of 2008. The reduction was achieved by bringing stock levels into line with current trading in the early part of the year and realising the benefit of a more sophisticated replenishment of stock in depots.  The net movement in creditors and debtors was £11.8m. As a result, 'underlying' working capital fell by £46.8m. However, payments relating to 'legacy' properties totalling £46.3m, including rent and rates and payments in respect of early termination of leases, meant that reported working capital was virtually unchanged.

Also included within net cash flows from operating activities was a cash contribution to the Group's pension schemes, in excess of the operating charge, of £20.9m (the 'pension deficit contribution') and tax paid totalling £5.0m.

Payments to acquire fixed and intangible assets totalled £8.1m (2008: £19.4m).

As a result of the above, there was a net cash inflow of £63.6m in 2009, resulting in Group net cash of £2.4m at 26 December 2009 (27 December 2008: £61.2m net borrowings). Excluding the payments relating to 'legacy' properties and the pension deficit contribution, there was a net cash inflow of £130.8m.

At 26 December 2009, the pension deficit shown on the balance sheet was £196.3m (29 December 2008: £122.2m). The increase in the deficit has been driven by the impact of changes in actuarial assumptions used to calculate liabilities, principally with respect to the discount rate and inflation. This has been partly offset by better than expected asset returns and the Company's contribution to clear the actuarial deficit. As announced in July 2009, the Company has agreed with the trustees of the Group's defined benefit pension scheme the deficit funding contributions for the three years ending April 2012.

DIVIDEND

The Board is not recommending a final dividend for 2009 (2008: nil).

OPERATIONAL REVIEW

The overriding strategic goal of Galiform was first set out in the original Howden Joinery business plan and remains unaltered. It is "To supply from local stock nationwide the small builder's routine kitchen and joinery requirements, assuring no call back quality and best local price".

Against the background of weak consumer confidence and general concerns about economic prospects, the Group continues to focus on opportunities to grow sales through improving its products and service, and increasing awareness of Howdens. We continue to work to increase profitability through greater efficiencies and to manage cash flow prudently.  Operations throughout the Group are continually reviewed so as to ensure appropriate resourcing levels.

In pursuing these goals, numerous actions have been taken, the most significant of which are as follows.

Depot network

Following satisfactory trading in the key period 11, the decision was taken to recommence our UK depot opening programme and eight new depots were opened in the last four weeks of the year. During the course of the year, two depots were also extended. This meant that 462 depots were trading at the end of 2009.

Product review

Last November, we said that we were at the early stages of reviewing our range of kitchens. The review has been completed.

We have now begun the phased roll-out of the new kitchens we selected, which will enable us to offer customers improved choice and service. Our selection process included the engagement of depot managers and designers in a series of major events that have been held nationwide, incorporating displays of the new kitchens being introduced.

The changes we are making will not affect the number of kitchen options we offer.

IT systems

We have introduced a new version of the 'Fusion' kitchen CAD tool that we use in our depots. This is used to plan kitchens for our customers.

Raw materials and finished products, manufacturing and logistics

We continually look to minimise the cost of raw materials and finished products that we buy-in, without compromising the quality of our products, their acceptability to our customers and the need to purchase responsibly. We regularly benchmark the cost of existing suppliers against alternatives, and we also look for ways to improve the efficiency of our manufacturing and logistics operations. If necessary, we change product design and specifications, so that lowest cost can be accessed. In doing this, we look not just at the direct purchase costs of raw materials and products but also the indirect costs incurred.  In 2009, we generated sourcing gains of over £18m and non-volume related logistics savings of £7m.

GROUP DEVELOPMENTS

Banking arrangements

The Group has successfully renegotiated the terms of its banking facility, which is provided by Burdale Financial Limited (a member of the Bank of Ireland Group) and Lloyds TSB Commercial Finance Limited.

Under the new terms, the facility will run for an additional three years, until May 2014.  The facility will enable the Group to borrow up to £160m.

As before, any loan under the facility carries interest at a rate of LIBOR plus a margin.  The minimum margin has increased by 25 basis points to 200, while the maximum of 300 basis points is unchanged.

Apart from a slight amendment to the fixed charge covenant, the existing covenants will apply for the additional three years.

Legacy properties

The number of 'legacy properties' now stands at 54 (this incorporates all guaranteed and residual properties, HDC's and Sofa Workshop stores), compared with 76 at the end of 2008.  Included within this are 23 properties that are fully or part occupied by tenants.

Since November 2009, a tenant was found for one vacant property prior to the year-end. The lease of one property, a Home Delivery Centre, was terminated after the year-end at a cost of £2.9m, mitigating future rent and rates that would have totalled over £12m at current rates.

The profile of legacy properties remaining and the net annual rent and rates (current values) for the associated leases, before any mitigating action is taken, is shown below.  The leases on three properties will expire in 2010.


31 - Dec 03-Mar As at 31 Dec 31 Dec 31 Dec 31 Dec

2008 2010 2011 2014 2019 2024
Number of properties 76 54 49 27 15 33
Net annual rent and rates, £m 24.5 17.6 16.6 8.7 6.3 0.4

The future costs associated with these properties have been provided for in exceptional charges incurred in 2009 and previous years.

  1. Guaranteed, residual, HDC and ex-Sofa Workshop properties - vacant and tenanted.
  2. Gross rent & rates less payments by tenants.
  3. All leases expire during the course of 2025.

Directorate change

Peter Wallis, who has made an invaluable contribution to the Board as a non-executive director since 2001, has decided to step down at the AGM on 19th May.  We are well advanced in recruiting a successor. 

CURRENT TRADING AND OUTLOOK FOR 2010

In what is the quietest time of year for the business, Howden Joinery UK depot total sales fell by 3.7%* in the first two periods of the year (to 20 February), with sales on a same depot basis down by 4.1%*. This result reflects the impact of the heavy snowfall and the prolonged period of cold weather seen in January and February.

For the rest of 2010, we expect market conditions to continue to be challenging and we are cautious about the outlook. As in recent years, we will continue to adapt our business model to the market and economic conditions we encounter.

The Group remains committed to its view that the number of depots in the UK can be increased to more than 600 in the longer term. During the course of 2010, we are planning to open between 20 and 30 depots, as part of our investment in the next stage of Howdens' growth and development.

Since its inception in 1995, Howden Joinery's share of the UK kitchen market is estimated to have grown to almost one-fifth in just 14 years and it now sells some 400,000 kitchens a year. Even in these challenging market conditions, we would expect our market share growth to continue, as the business continues to benefit from the growth of its depots that have yet to reach maturity and we open new depots.

*Note 1: Week 1 sales excluded because of distortion arising from New Year's Day falling on different days of the week (Thursday in 2009, Friday in 2010), which meant there was no trading in the first week of this year(2009: £0.8m).

RISKS AND UNCERTAINTIES

MANAGEMENT OF COMMERCIAL RISK AND UNCERTAINTIES

Defined benefit pension scheme

Accounting for pensions and other post-retirement benefits involves judgement about uncertain events, including estimated retirement dates, salary levels, mortality rates, inflation rates, rates of return on scheme assets and determination of discount rates for measuring plan obligations.  The assumptions used from year to year may vary, which will affect future results of operations.  Any difference between these assumptions and the actual outcome also affects future results of operations.  Pension assumptions are discussed and agreed with the independent actuaries in December each year.  These assumptions are used to determine the projected benefit obligation at the year end and hence the liability or asset recorded on the Group's balance sheet.

At 26 December 2009, the Group's defined benefit pension scheme had a deficit of £196.3m (2008: £122.2m).  Changes in this deficit are affected by the assumptions made in valuing the liabilities and the market performance of the assets. Most importantly, the discount rate used for measuring the defined benefit liabilities has decreased from 6.3% in 2008 to 5.6% in 2009.

As part of the secured lending facilities announced on 17 February 2006, the Company and the Trustees together with the Pensions Regulator reached agreement with regard to the funding of the remaining deficit. The Trustees have been granted security over the Group's shares in Howden Joinery Limited.

As part of the triennial valuation, which was completed in 2009, the Group and its pension trustees agreed a schedule of contributions until April 2012. The payment schedule is based on the Group's profit performance, which means that payments will be reduced should performance deteriorate significantly.

Legacy properties

At the end of 2009, the Group was responsible for a total of 55 properties with a net annual rent and rates liability of £18.2m. These properties included non-trading MFI properties excluded from the sale of MFI in October 2006, and properties guaranteed by the Group, the liabilities for which reverted to the Group following the administration of MFI and Sofa Workshops. We have already substantially reduced the total number of legacy properties for which we are liable and we continue to work to mitigate our current and future liabilities. As a result, total property provisions at the 2009 year end totalled £84.4m compared with £115.7m in 2008.  These provisions are reviewed on a regular basis to ensure that the Group is adequately covered in respect of reasonably foreseeable events.

Since the year end we have agreed with a landlord to terminate a lease, reducing our annual rent and rates liability by a further £0.6m.

Market conditions

The Group's products are sold to professional fitters for installation in public and private housing, predominantly in the repair, maintenance and improvement market. The results are consequently dependent on levels of activity in these markets, which in turn are impacted by many factors including general economic conditions, consumer confidence, interest rates and credit availability, unemployment, demographic trends and, in the short term, weather. We monitor the market closely and can take swift management action to address any adverse change. During the earlier part of 2009, we suspended our depot opening programme and reduced our staff numbers with a view to conserving cash and ensuring our ability to work within our borrowing facilities and covenants. The Group will take action as necessary to ensure that the business is aligned to market conditions.

IT systems

The business involves high transaction volumes and complex logistics.  We are therefore heavily dependent on the resilience of both the application software and the data-processing and network infrastructure in our depots, logistics operations and back-office functions. A serious failure could immediately and materially affect our business. The Group has a detailed disaster recovery plan in place. Our main data centre in Northampton has high levels of resilience built into it and we also have a physically separate third party disaster-recovery site in Harrogate.

Continuity of supply

Any disruption to the relationship with key suppliers could adversely affect the Group's ability to meet its sales and profit plans if suitable alternatives could not be found quickly. The Group strives to maintain dual supply wherever possible in the event that one supplier is unable to deliver goods or services. Good supplier relations are maintained by regular communication, an annual supplier conference and prompt settlement of invoices.

Failure to implement business strategy

The future success of Howden Joinery's business depends on the successful implementation of the Company's strategy and culture. In particular, if the Group fails to implement Howdens' business model in the locally enabled, decentralised manner envisaged, there may be an adverse affect on the Group's future financial condition and results of operations.

Product design leadership

If there was a misalignment between the products we offer and the requirements of our customers and the current trends in the market, there may be an adverse change on the Group's future financial condition and results of operations. Active engagement with suppliers, independent research and, critically, depot managers and their designers encourages and enables product development activity.

Loss of key personnel

The Group's success depends largely on the skills, experience and performance of some key members of its management team. The loss of any key members of the Group's management may adversely affect the Group's financial condition and results of operations. The Group utilises the Remuneration Committee to ensure that team members are appropriately compensated for their roles.

MANAGEMENT OF FINANCIAL RISK AND UNCERTAINTIES

The Group holds financial instruments for one principal purpose: to finance its operations. The Group does not currently use derivative financial instruments to reduce its exposure to interest or exchange rate movements.  The Group finances its operations by a mixture of cash flows from operations and longer term loans from banks.  Treasury operations are managed within policies and procedures approved by the Board.

The main risks arising from the Group's financial instruments are funding and liquidity risk, interest rate risk, counterparty risk and foreign currency risk discussed below.

No speculative use of derivatives, currency or other instruments is permitted.  The Treasury function does not operate as a profit centre and transacts only in relation to the underlying business requirements.

Funding and liquidity

The Group's objective with respect to managing capital is to maintain a balance sheet structure that is both efficient in terms of providing long-term returns to shareholders and safeguards the Group's ability to continue as a going concern.  As appropriate, the Group can choose to adjust its capital structure by varying the amount of dividends paid to shareholders, returns of capital to shareholders, issuing new shares or the level of capital expenditure. During 2009, the Group had a £175m asset-backed bank facility which was due to expire in May 2011. Since the year end, the maturity of the facility has been extended until May 2014.  As part of the extension, the facility has been reduced to £160m, alongside a revised interest rate structure and a slight amendment to the fixed charge covenant.

The Group's committed borrowing facility contains certain financial covenants which have been met throughout the 2009 year.  The covenants are tested every four weeks and are based around: (i) fixed charges; (ii) tangible net worth; and (iii) earnings before interest, tax, depreciation and amortisation (EBITDA) for Howden Joinery.

In addition, our pension trustees, who carry a charge over the share capital of Howden Joinery Limited, have a separate covenant test around the EBITDA of Howden Joinery as a standalone business unit.

The current economic conditions create uncertainty around the Group's trading position, particularly over the level of demand for the Group's products and the exchange rate between sterling and both the Euro and the US dollar.  The Group's latest forecasts and projections have been stress-tested for reasonably possible adverse variations in trading performance and show that the Group will operate within the terms of its borrowing facility and covenants for the foreseeable future.  The covenant with the lowest headroom is the EBITDA for Howden Joinery, which is calculated each four-week period on a three or six-period rolling basis, such that short-term variability in trading performance would increase the risk of non-compliance.  Nevertheless, whilst there can be no absolute certainty, after due consideration of the impact of a reasonably possible further decline on the recent trading performance experienced, it is not considered that this covenant will be breached in the foreseeable future.

The cash drawdown against the bank facility at the year end was £11.6m and, after taking into account other utilisation of the facilities for terminable indemnities, the Group was left with £110.5m of available funds.

Interest rate risk

The Group's exposure to interest rate fluctuations on its borrowings may be managed when necessary by borrowing on a fixed rate basis and entering into rate swaps, rate caps and forward rate agreements. The Group's policy objective has been to undertake transactions of this nature only when net debt exceeds £150m.  Net debt has not exceeded £150m during the year.

Counterparty risk

Group Treasury policy on investment restricts counterparties to those with a minimum Standard and Poor's/Moody's long term credit rating of AA- and a short term credit rating of A-1/P-1.  Investments mainly consist of bank deposits and certificates of deposit.  The Group continuously reviews the credit quality of counterparties, the limits placed on individual credit exposures and categories of investments.

Foreign currency risk

The most significant currencies for the Group are the US dollar and the Euro.  It is difficult to pass the prescribed tests under IAS 39 'Financial Instruments: Recognition and Measurement' to ensure the ability to hedge account for derivative currency transactions.  As the resultant volatility cannot be avoided in the profit and loss account, it is the view of the Board that routine transactional conversions between currencies are completed at the relevant spot exchange rate.  This policy is reviewed on a regular basis.

The net adverse impact of exchange rates on currency transactions in the year, compared to the previous year, was to increase cost of sales by £11.7m to £337.4m. The Group does not have many overseas assets/liabilities, so the impact of currency translation is not material.

Set out in the table below are the principal exchange rates affecting the Group's profits.

Principal exchange rates 2009
Average
2009
Year-end
2008
Average
2008
Year-end


United States dollar (US$) 1.57 1.60 1.86 1.49
Euro (€) 1.12 1.12 1.26 1.06


DIRECTORS' RESPONSIBILITY STATEMENT

The directors confirm that to the best of their knowledge:

  • the financial statements, prepared in accordance with the applicable set of accounting standards, give a true and fair view of the assets, liabilities, financial position and profit or loss of the Company and the undertakings including the consolidation taken as a whole; and
  • the review of operations and finance along with other documents which are incorporated into the directors' report, together include a fair review of the development and performance of the business and the position of the Company and the undertakings including the consolidation taken as a whole together with a description of the principal risks and uncertainties they face.

By order of the Board

M Ingle                                 M Robson
Chief Executive Officer            Chief Financial Officer
3 March 2010                       3 March 2010

Consolidated income statement


52 weeks to 26 December 2009
52 weeks to 27 December 2008

Notes Before exceptional items
£m
Exceptional items
(note 3)
£m
Total
£m

Before exceptional items
£m
Exceptional items
(note 3)
£m
Total
£m
Continuing operations:


Revenue - sale of goods
769.5 - 769.5
805.7 - 805.7
Cost of sales
(337.4) - (337.4)
(378.2) 1.0 (377.2)
Gross profit
432.1 - 432.1
427.5 1.0 428.5
Selling & distribution costs
(294.0) - (294.0)
(298.3) 1.5 (296.8)
Administrative expenses
(58.6) - (58.6)
(53.4) 0.4 (53.0)
Other operating (expenses)/income
- (0.1) (0.1)
- 1.9 1.9
Share of joint venture profit
- - -
0.1 - 0.1
Operating profit
79.5 (0.1) 79.4
75.9 4.8 80.7
Finance income 4 0.2 - 0.2
1.4 - 1.4
Finance expense 5 (3.0) - (3.0)
(6.3) - (6.3)
Other finance (expense)/income - pensions 5 (8.0) - (8.0)
3.3 - 3.3
Profit before tax
68.7 (0.1) 68.6
74.3 4.8 79.1
Tax on profit 6 (18.5) - (18.5)
(23.3) (0.8) (24.1)
Profit after tax
50.2 (0.1) 50.1
51. 0 4.0 55.0


Discontinued operations:


Loss before tax
- (4.4) (4.4)
- (108.8) (108.8)
Tax on loss 6 - - -
- 2.6 2.6
Loss after tax
- (4.4) (4.4)
- (106.2) (106.2)


Profit/(loss) for the period attributable to the equity holders of the parent
50.2 (4.5) 45.7
51. 0 (102.2) (51.2)


Earnings per share:


pence


pence
From continuing operations


Basic earnings per 10p share 7

8.3


9.2
Diluted earnings per 10p share 7

8.3


9.0


From continuing and discontinued operations


Basic earnings/(loss) per 10p share 7

7.6


(8.6)
Diluted earnings/(loss) per 10p share 7

7.5


(8.4)

Consolidated balance sheet


Notes
26 December 2009
£m

27 December 2008
£m
Non current assets


Goodwill

2.5
2.5
Other intangible assets

5.4
6.2
Property, plant and equipment

79.5
89.4
Investments

2.0
4.0
Deferred tax asset

73.6
52.6


163.0
154.7
Current assets


Inventories

86.3
121.3
Trade and other receivables

95.4
99.2
Other assets

0.7
1.3
Cash at bank and in hand

14.0
21.2


196.4
243.0
Total assets classified as held for sale

-
1.0
Total assets

359.4
398.7


Current liabilities


Trade and other payables

(119.4)
(120.4)
Current tax liability

(12.8)
(4.9)
Current borrowings

(2.3)
(3.4)


(134.5)
(128.7)
Non current liabilities


Non current borrowings

(10.0)
(80.3)
Pension liability

(196.3)
(122.2)
Deferred tax liability

(5.5)
(5.5)
Provisions 9
(86.8)
(119.8)


(298.6)
(327.8)
Total liabilities

(433.1)
(456.5)


Net liabilities

(73.7)
(57.8)


Equity


Called up share capital 10
63.4
63.4
Share premium account 10
85.1
85.1
ESOP reserve 10
(27.5)
(27.1)
Other reserves 10
28.1
28.1
Retained loss 10
(222.8)
(207.3)
Total deficit

(73.7)
(57.8)
The financial statements were approved by the Board on 3 March 2010 and were signed on its behalf by Mark Robson - Chief Financial Officer.


Consolidated cash flow statement


Notes 52 weeks to
26 December 2009
£m
52 weeks to
27 December 2008
£m
Net cash flows from operating activities 11 71.4 (37.8)


Cash flows used in investing activities


Interest received
0.2 1.5
Cash flow from acquisition
- 3.2
Repayment of investment
2.0 4.0
Payments to acquire property, plant and equipment and intangible assets
(8.1) (19.4)
Receipts from sale of property, plant and equipment and intangible assets
1.2 3.5
Net cash used in investing activities
(4.7) (7.2)


Cash flows from financing activities


Interest paid
(3.1) (8.5)
Receipts from issue of share capital
- 0.1
(Decrease)/increase in loans
(69.7) 44.1
Repayment of capital element of obligations under finance leases
(1.7) (1.2)
Decrease in other assets
0.6 1.1
Dividends paid to Group shareholders
- (3.0)
Net cash (used in)/ generated from financing activities
(73.9) 32.6


Net decrease in cash and cash equivalents
(7.2) (12.4)
Cash and cash equivalents at beginning of period 11 21.2 33.6
Cash and cash equivalents at end of period 11 14.0 21.2

For the purpose of the cash flow statement, cash and cash equivalents are included net of overdrafts payable on demand. These overdrafts are excluded from the definition of cash and cash equivalents disclosed on the balance sheet.

Cash flows from discontinuing operating activities are shown in note 11. There are no cash flows from discontinued investing or financing activities.

Consolidated statement of recognised income and expense


52 weeks to
26 December 2009
£m
52 weeks to
27 December 2008
£m
Actuarial losses on defined benefit pension schemes
(87.0) (66.3)
Deferred tax on actuarial losses on defined benefit pension schemes
24.4 18.6
Deferred tax on share schemes
2.1 -
Currency translation differences
(0.7) 1.4
Net expense recognised directly in equity
(61.2) (46.3)
Profit/(loss) for the financial period
45.7 (51.2)
Total recognised income and expense for the period attributable to equity holders of the parent
(15.5) (97.5)


HOWDENS Making space more valuable

Business Model and Strategy

Find out more about our business model and strategy, the markets in which we operate and our strategic approach to protect our unique business model and ensure that the business continues to grow.
Depots

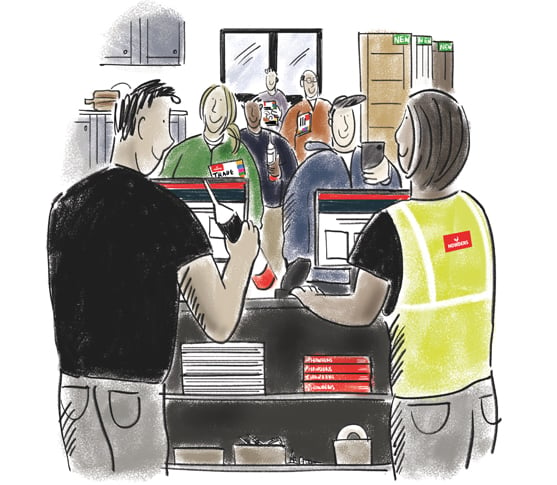
As a familiar sight across towns and cities in the UK and Europe, our depots are always within easy reach, so a trade professional never has far to travel to find their nearest Howdens. Get to know more about how each one operates.
Sustainability

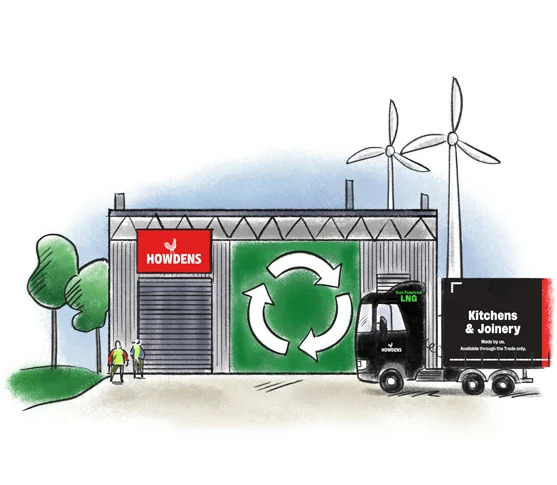
Our sustainable behaviour is at the heart of our business and enables us to reduce some of our risks. We take great pride in ensuring that our business positively impacts the world around us and the people within it.

Community

We are passionate about supporting the local communities we operate in, which is why our depots and support staff actively seek ways to give something back. Whether it is running half marathons or sponsoring local Scout groups, discover the many ways we help good causes.

Products

With around 80 kitchen ranges, our exclusive Lamona appliance brand, and thousands of products across joinery and hardware, learn why our builders have come to trust the range and quality of the products we offer.

People and Careers

The Sunday Times named Howdens as one of the top 25 big companies to work for. Discover why Howdens is a great place to work, how we develop our people and reward them, whilst building a culture with an entrepreneurial spirit.
Financial Results

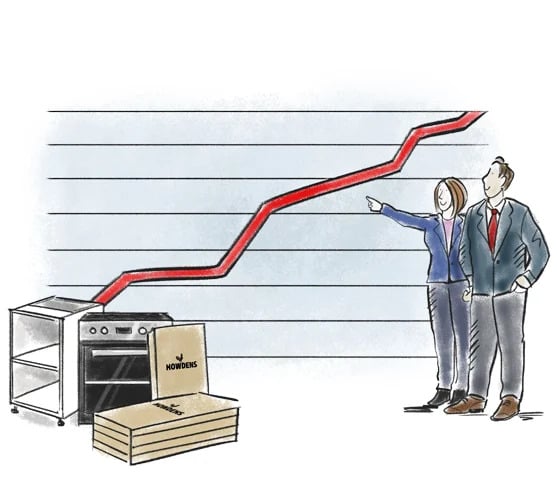
Download copies of the latest financial results for Howdens both past and present including the associated presentations and Interim Management Statements released between results announcements.

Governance

Howdens is a responsible business which was founded on the tenet that the Company should be worthwhile for all concerned, with a commitment to the people within its reach and the wider world. Here we provide the links to the framework that informs our decisions and outcomes.